

A Look Into The Markets - Oct 26, 2025
Gold prices reached all-time highs before retreating as investors locked in profits. As gold prices declined, some of that capital flowed into the bond market, which saw higher prices and lower yields. The wild price swings in gold highlight the significant uncertainty in the markets, particularly around inflation, Federal Reserve policy, and global growth.
The quick reversal also serves as a reminder that even safe havens are not immune to volatility. Gold's surge to new highs reflects the demand for protection, but its pullback demonstrates how quickly sentiment can shift when interest rates and inflation expectations change.
"Black gold" swings: ceasefire brings calm, sanctions add heat
Oil prices, often called "black gold," recently fell to near their lowest levels of 2025 as news of an Israel-Hamas ceasefire eased geopolitical tensions. The removal of this "risk premium" alleviated pressure on crude prices, contributing to both oil prices and interest rates reaching their lowest levels of the year. For a moment, the markets found relief as fears of a wider conflict faded.
However, the calm was short-lived. Fresh sanctions targeting Russian oil exports quickly drove prices higher again. Tighter supply concerns reversed some of the recent gains in bonds, exerting upward pressure on yields and mortgage rates. This serves as a reminder that energy prices and interest rates often move in tandem: lower oil prices can signal reduced inflation expectations, while rising oil prices tend to reignite inflation concerns and push rates higher.
Volatility in "black gold" continues to drive broader market swings. As long as energy markets remain sensitive to headlines, bond prices and interest rate movements are likely to follow suit.
The trend is your friend, until it ends
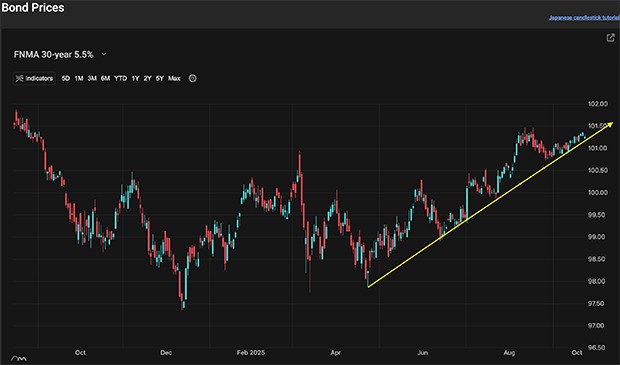
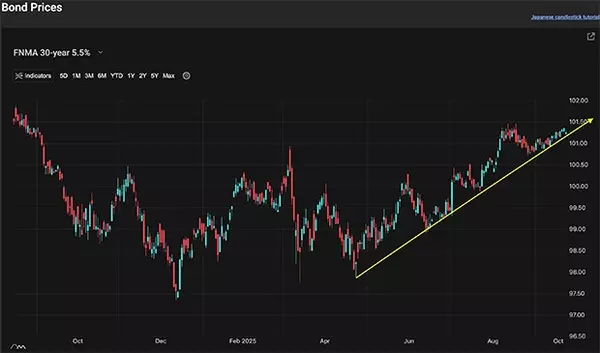
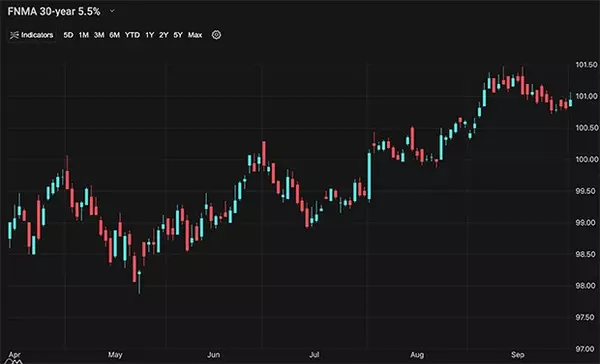
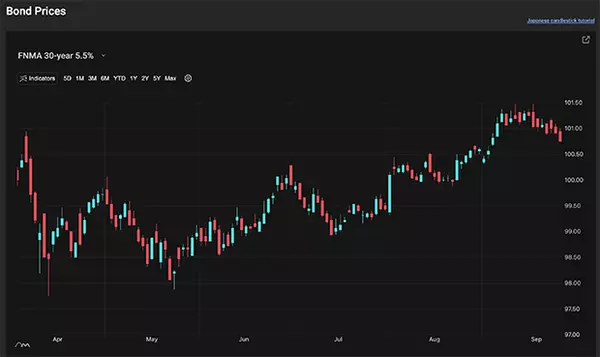
The U.S. bond market has been on a strong upward trend since May, forming higher highs and higher lows in price, which translates to lower yields over time. This trend remains intact but is currently being tested. Refer to the chart section below for a visual representation of mortgage bonds, from which mortgage rates are derived. The 10-year Treasury note has also exhibited a consistent downward trend in yield, hovering below 4.00%. More details follow below - read on.| 30-yr mortgage rates | 23-Oct-25 | |
| 6.19% | ||
| -.09% WoW (6.27%) | -.35 YoY (6.54%) | |
| 10-year note yield | 24-Oct-25 | |
| Below 4.50% | ||
| This time 2024: Below 4.50% | ||
Looking ahead
Next week the main event is the October Fed Meeting. It is widely expected the Fed will lower rates by .25%. It is important to note that long-term bonds have already priced this in, and it should be of no surprise. It may seem contrarian or odd, but long-term bonds have not performed well after the last few rate cuts dating back to last year. Why? Because lower rates allow for more inflation which long-term bonds do not like.
Mortgage Market Guide candlestick chart
As we shared above, the trend is your friend until it ends. Mortgage bonds continue to climb higher, making higher highs and higher lows. As long as this trend remains intact, we should expect lower rates in the future. However, this trend is getting tested right now, if prices reverse lower (higher rates) and the trend ends, we should expect higher rates ahead.
Chart: Fannie Mae 30-Year 5.5% coupon (Friday, October 24, 2025)
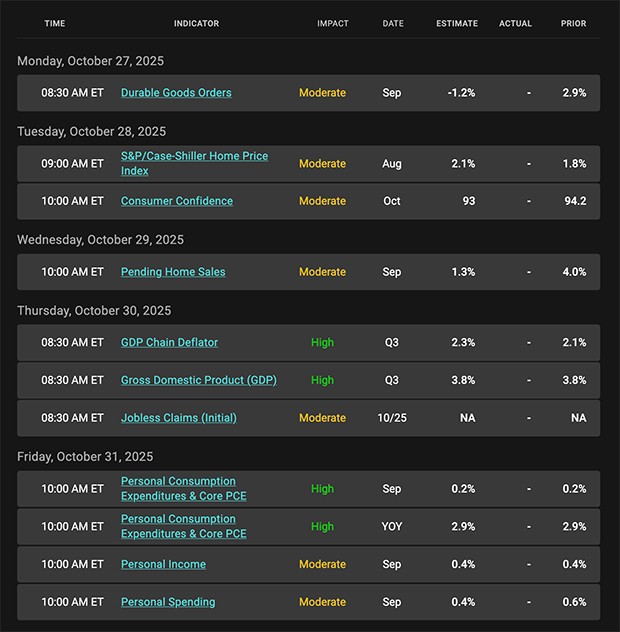
Economic calendar for the week of October 27 - 31
 |
|
Categories
Recent Posts


concierge@pennergroupproperties.com
16037 SW Upper Boones Ferry Rd Suite 150, Tigard, OR, 97224