
A Look Into The Markets - Oct 3, 2025
This past Wednesday, the ADP National Employment Report dropped its latest update on U.S. private sector hiring for September, giving us a peek at how businesses are adding jobs.
"We do not seek or welcome further cooling in labor market conditions" Fed Chair Jerome Powell August 2024
How did it look? Private sector employment declined by 32,000 jobs in September, marking a rare contraction in the ADP report. Alongside the weaker job growth, pay gains remained near unchanged at 4.5% year-over-year.
Adding to the softness, the August ADP payrolls figure was revised lower, reinforcing the trend that hiring momentum is easing more than initially thought amidst the uncertain backdrop.
"Despite the strong economic growth we saw in the second quarter, this month's release further validates what we've been seeing in the labor market, that U.S. employers have been cautious with hiring." Dr. Nela Richardson – Chief Economist, ADP.
The takeaway: This data points to a labor market that has lost some momentum. This has caught the attention of the Fed and will likely lead to another rate cut later this month.
Housing prices are also cooling
The Case-Shiller Home Price Index showed U.S. home prices took another small step down in July; the fifth month in a row of declines. It's not a crash; prices are still up from last year, but the growth is slowing way down, like a car easing off the gas. Here's the simple breakdown:
- National index: Prices dropped 0.1% from June to July (after adjusting for normal seasonal ups and downs, like more sales in summer). Compared to July 2024, they're up 1.7%; the tiniest yearly gain since July 2023, and the sixth straight month of weaker growth. When you factor in inflation (rising costs eroding buying power), it's actually down 0.3% monthly and 2.3% yearly. In other words, homes feel cheaper in real terms.
- 20-city index: Same story; down 0.1% month-over-month, up 1.8% year-over-year (slowest in two years). Inflation-adjusted: -0.3% monthly, -2.2% yearly. This covers hot spots like Denver, Miami, and Seattle.
- 10-city index: Also, down 0.1% monthly, but holding a bit stronger at +2.3% yearly. Inflation hits it to -0.4% monthly and -1.7% yearly. Think coastal powerhouses like NYC and San Francisco.
Why does this matter?
This cooling trend signals price normalization after a housing boom with years of sky-high price appreciation fueled by low rates and pandemic shifts. Relatively higher mortgage rates are scaring off some buyers, inventory is low, and affordability remains a challenge, meaning fewer sales and softer prices. This is welcome news for home hunters waiting for deals, but tougher for sellers and homeowners eyeing equity. Overall, it's a sign of stabilization, not panic as prices aren't plummeting, just growing more like normal times.
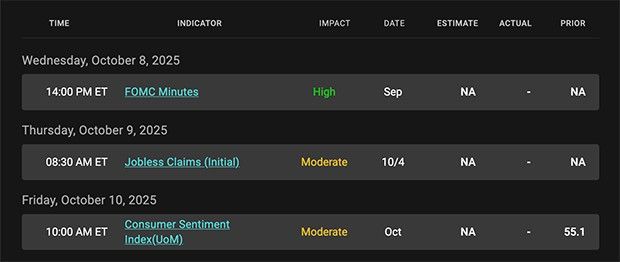
Fed watch
The CME Fed Watch tool shows the Fed Funds Futures are currently pricing in two rate cuts to finish 2025. This means the federal funds rate would fall from its current range of 4.00% to 4.25% to a range of 3.50% to 3.75%. The Fed Funds Rate has no impact on mortgage rates but will help lower all short-term rates like credit cards, auto loans and home equity lines of credit. Unfortunately, it will also lower interest you receive in savings accounts.| 30-yr mortgage rates | 2-Oct-25 | |
| 6.34% | ||
| +.04% WoW (6.30%) | +.22 YoY (6.12%) | |
| 10-year note yield | 3-Oct-25 | |
| Below 4.50% | ||
| This time 2024: Below 4.50% | ||
 |
|
Categories
Recent Posts