
A Look Into The Markets - Dec 26, 2025
What this GDP report really means
This week, the GDP report showed the economy grew at a strong 4.3% annualized pace in the third quarter, well above expectations at the highest growth rate in 2 years. However, it's important to understand that this report was impacted by the federal government shutdown in October and November, which delayed a lot of the normal data used to calculate GDP. Because of that, this estimate relies on a mix of standard data and assumptions, making it less precise than usual. In short: the headline number is solid, but it comes with an asterisk.
So where did the growth come from? The biggest driver was consumer spending. Americans continued to spend more on everyday services like health care, travel and professional services, as well as goods such as recreational items, vehicles and prescription drugs. Exports also increased, meaning U.S. businesses sold more goods and services overseas. Government spending contributed as well, particularly at the state and local level and through federal defense spending.
On the flip side, business investment declined, mainly because companies reduced inventories. This could be a signal that businesses are becoming a bit more cautious and don't want to overstock in an uncertain environment. Imports fell as well, which mathematically boosts GDP, but can also reflect softer domestic demand.
Why this matters for rates, housing, and affordability
The key takeaway is this: while the economy is still growing, the type of growth matters. Spending on services and essentials is holding up, but businesses are being more cautious. That's an important distinction for interest rates and the overall economy as we head into 2026.
For housing and affordability, this report supports the idea that the economy doesn't need aggressively high interest rates to keep inflation in check. Slower business investment and cooling inflation pressures give the Fed more room to eventually ease policy.
Bottom line: The economy grew, but not in a way that should scare the Fed into staying overly restrictive—and that's a constructive signal for mortgage rates as we move forward
Big money bets on the 10-year Treasury
Over the past week, large institutional traders have been placing unusually big bets on the 10-year Treasury, specifically using March options contracts. One trade alone involved roughly $80 million in premium, with open interest jumping more than 300% in a single week. That kind of activity doesn't happen often and signals that new money is coming into the market; not just traders rolling old positions forward. In simple terms, sophisticated investors are positioning ahead of a potential shift in interest rate expectations. This could be a positive sign as the calendar turns.What makes this activity even more notable is the timing. These trades occurred even as Treasury yields moved slightly higher, with the 10-year ending the day near 4.16%. Another large trade and about $28 million in premium targeted a move toward a 4.05% yield on the 10-year, sitting a bit beneath current levels. Both positions expire shortly after the Fed's January meeting, suggesting traders are looking ahead to how Fed messaging and economic data could influence rates in early 2026.
The takeaway is important for mortgage markets. When large players place this kind of money around specific yield levels, it often reflects growing confidence that long-term rates may stabilize or move lower, even if day-to-day trading remains choppy. While this doesn't guarantee lower mortgage rates, it does reinforce the idea that the bond market is increasingly focused on what comes after the Fed's next policy decision and not just where rates are today.
| 30-yr mortgage rates | 25-Dec-25 | |
| 6.23% | ||
| +.02% WoW (6.21%) | -.62% YoY (6.85%) | |
| 10-Year Treasury Note Yields | 26-Dec-25 | |
| 4.16% | ||
| +.01% WoW (4.15%) | -.79% YoY (4.59%) | |
Rate information shared here reflects the national average and is not a guarantee of rates available.
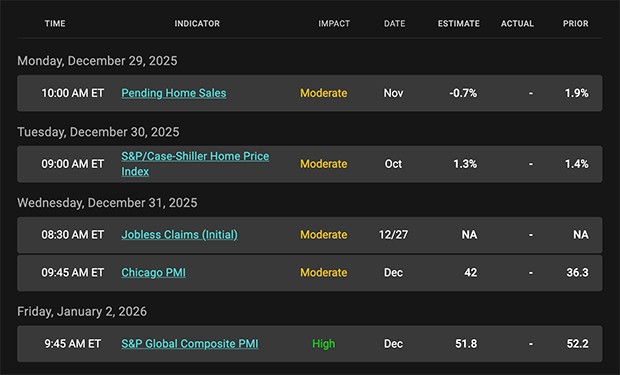
Looking ahead
Next week will be an important one as markets digest this latest batch of inflation data and recalibrate expectations for interest rates in early 2026. With the Fed now in a wait-and-see mode, incoming economic data will take on added importance, particularly anything that confirms or challenges the recent trend of cooling inflation. Investors will be focused on whether the low inflation report was a one-off or the beginning of a more durable slowdown in price pressures.
With lighter holiday trading conditions lingering, markets may be more sensitive to headlines than usual. For mortgage rates, that means continued movement, but the broader setup remains constructive if inflation continues to behave and long-term yields hold their recent ranges.
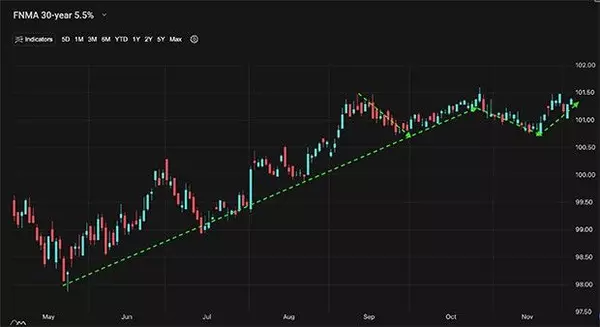
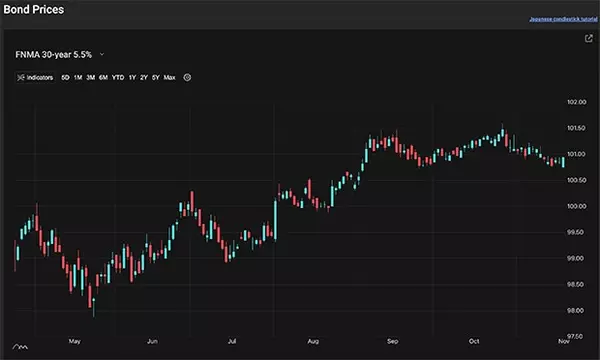
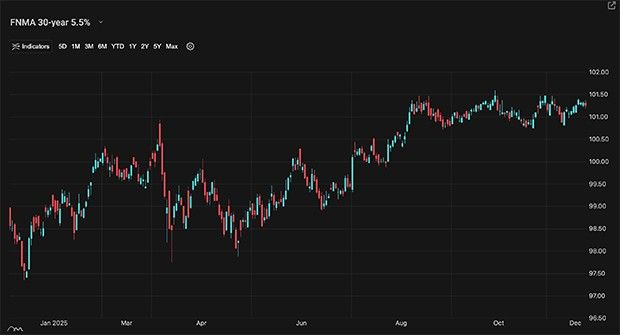
Mortgage Market Guide Candlestick Chart
 |
|
Categories
Recent Posts