
A Look Into The Markets - Nov 14, 2025
In a significant development amid the longest U.S. government shutdown in history, spanning over 40 days, lawmakers in the House of Representatives passed a funding package that would reopen federal operations before the weekend. This shutdown has disrupted everything from air travel to economic data releases. The good news? Paychecks to hundreds of thousands of affected federal employees will be delivered.
Financial markets have reacted with evident relief and enthusiasm, erasing much of the uncertainty that had lingered despite the shutdown's relatively muted direct impact on stocks. Wall Street indices surged on Tuesday, with the S&P 500 and Nasdaq posting gains of over 1.5% each, driven by a rebound in technology stocks and broader investor bets on normalized economic reporting and policy continuity. Bond yields have improved while the markets await a flood of pent-up economic data; prioritizing September figures that could provide clearer insights into inflation and growth.
Speaking of Economic Growth
The shutdown has imposed substantial economic costs, with estimates ranging from $7 billion to $16 billion per week in lost output due to furloughed workers, delayed payments, and disrupted services.
The White House's Council of Economic Advisers pegs the weekly hit at $15 billion, while the Congressional Budget Office (CBO) forecasts a $18 billion reduction in fourth-quarter GDP alone, alongside a permanent economic loss of $7 billion to $14 billion that won't be fully recoverable even after reopening. This drag equates to a 0.8% to 2% shave off annualized GDP growth for the period, effectively wiping out about half of the 1.6% expansion seen in the first half of the year and raising the specter of a technical recession if the impasse had extended further.
Despite the government re-opening, a lack of clarity will persist a bit longer. The shutdown's "economic fog" stems from data blackout. There is breaking news that both the October unemployment and October CPI inflation report will be delayed even further with the BLS focusing on delivering the November readings…this once the September Jobs Report is finally released.
While the reopening promises a backpay-fueled spending rebound to offset most reversible damage, a looming funding deadline on January 30, 2026, threatens renewed disruptions. Economists like those at Goldman Sachs now project subdued Q4 growth at just 1%, underscoring how this shutdown has eroded consumer confidence headed into the holiday season.
Mortgage Activity Up
Mortgage activity edged up modestly in the most recent week, per the Mortgage Bankers Association's survey ending November 8, 2025, with overall applications rising 0.6% seasonally adjusted; the first gain after weeks of declines tied to high rates and shutdown uncertainty. Purchase applications surged 6%, hitting September highs and up 31% year-over-year, boosted by rising inventory and easing home price growth.| 30-yr mortgage rates | 13-Nov-25 | |
| 6.24% | ||
| +.02% WoW (6.22%) | -.54% YoY (6.78%) | |
| 10-Year Treasury Note Yields | 14-Nov-25 | |
| 4.09% | ||
| -.02% WoW (4.11%) | -.61% YoY (4.70%) | |
4.00 to 4.20
Last year, the 10yr Note yield spent most of its time above 4.20% and for the past several weeks the 10-yr has remained beneath 4.20%. This is a good sign for potentially lower rates ahead. A move convincingly beneath 4.00% a level the 10-yr which has not traded beneath for any sustained period in over two years, would be a welcome development for those looking for lower rates.
Looking Ahead
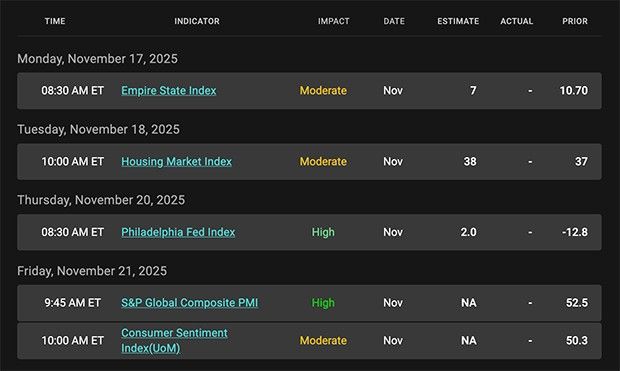
This coming week, market participants will monitor a slate of regional and sector-specific U.S. economic indicators amid ongoing scrutiny of labor market resilience and Fed policy signals. Kicking off on Monday, the New York Empire State Manufacturing Index will be released. Tuesday, brings the high-impact ADP Employment Change report, expected to reflect private-sector hiring trends after a prior dip of 11,250 jobs. The NAHB Housing Market Index for homebuilder sentiment and the New York Fed Services Activity Index, will also hit the wires on Tuesday.
Wednesday brings the main event
The FOMC meeting minutes release at 2 p.m. ET, offering deeper insights into the central bank's recent deliberations on rates and inflation. With Fed officials divided on whether to cut rates in December, the markets will be very tuned in to this event.
Thursday features the Philadelphia Fed Manufacturing Index at and Existing Home Sales data. Scattered Fed speeches, including from Governors Waller and Barr, could further shape expectations for monetary policy amid lingering rate uncertainty as we approach the December Fed Meeting.
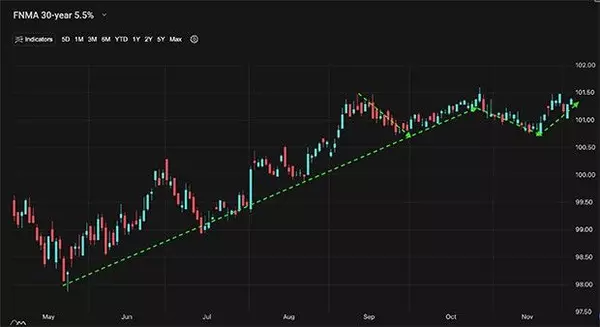
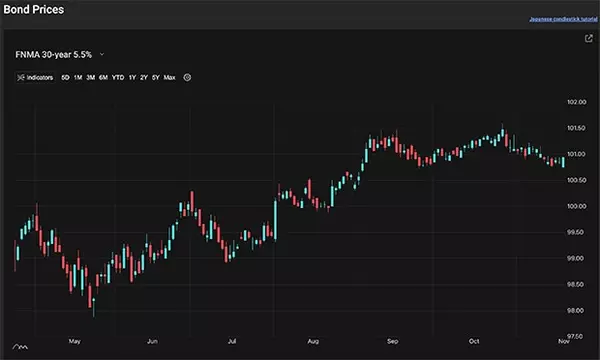
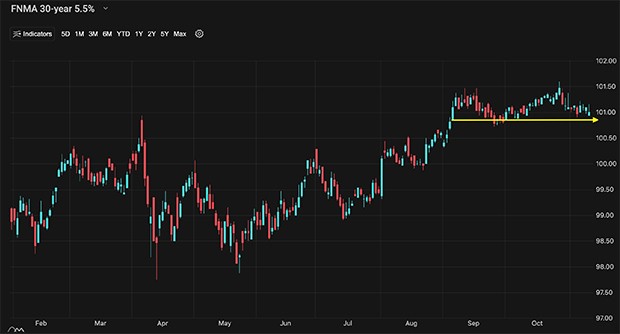
Mortgage Market Guide Candlestick Chart
Each candle represents one day of trading. As mortgage bond prices move higher, rates move lower. You can see on the right side of the chart, prices moving sideways near the best levels of the year; this means home loan rates continue to hover near the best levels of the year.
Chart: Fannie Mae 30-Year 5.5% coupon (Friday, November 14, 2025)
Economic calendar for the week of November 17 - 21
 |
|
Categories
Recent Posts